「Rでグラフ作成」-基礎の基礎の入門編-を写経してみる
以下のサイトが非常に分かりやすいので写経してみる!
https://www.agr.nagoya-u.ac.jp/~seitai/document/R2009/R_graph_yk.pdf
使用するデータも、以下のページからダウンロードできる。
R講習会 2009 のお知らせ
(環境)
Windows 8.1
Excel 2016
R Studio 1.1.383
(1)データのダウンロード
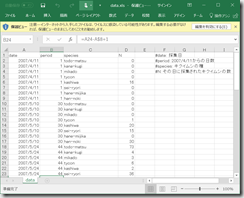
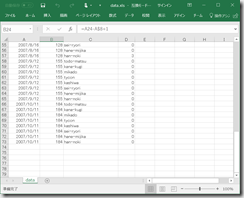
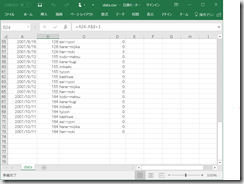
以下のページから、「使用データ」をダウンロードして保存。data.xls という名前のエクセルファイルである。
file:///C:/r/nagoya/R%20%E8%AC%9B%E7%BF%92%E4%BC%9A%202009%20%E3%81%AE%E3%81%8A%E7%9F%A5%E3%82%89%E3%81%9B.html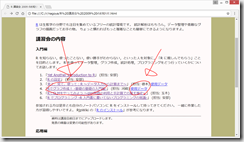
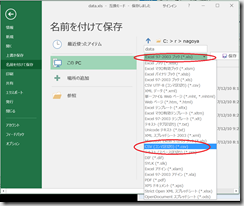
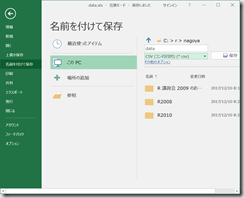
data.xls を開いて、csv形式で保存。
(2)data.csv の読み込み
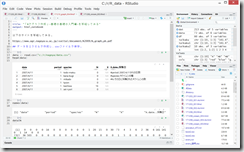
data <- read.csv("c:/r/nagoya/data.csv")
head(data)
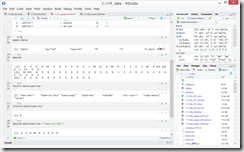
Knit html で出力したhtmlファイルを、一部、以下にコピペ
データをエクセルで作成し、csvファイルで保存。
Hide
● csvファイルの読み込み
data <- read.csv("c:/r/nagoya/data.csv")
head(data)
● 列の名前 row namesの確認 names()
names(data)[1] "date" "period" "species" "N" "X" "X.date..採集日"● 全体のデータのうち、個体数(N)だけ知りたい $
data$N # dataの中のN
 [1]   0   0   0   0  16   0   0   0   0   0   0   1  20  15   0  30  73   4   3   6   2  36   6 161 141   0   1  14   0   0
[31]  36 503   0   0   0   0   0   0   0   0   0   0   0   0   0   0   1   5   0   0   0   0   0   0   0   3   0   0   0   0
[61]   0   0   0   0   0   0   0   0   0   0   0   0
● 全体のデータのうち、どんな種類のキクイムシがいるかが知りたい levels()
levels(data$species)
[1] "han-noki" "hane-mijika" "kana-kugi" "kashiwa" "mikado" "sei-ryori" "todo-matsu" "tycon" ● キクイムシの種数がほしい nlevels()
nlevels(data$species)
[1] 8● 全体のデータのうち、種speciesがhane-mijika という条件の個体数Nだけ知りたい
条件は、[ ] で囲む。== を2つつなげる。文字の場合は、” ” で囲む。
data$N[data$species=="hane-mijika"][1] 0 0 6 36 0 1 0 0 0● クロス集計 table()
table(data$species, exclude=NULL)
   han-noki hane-mijika   kana-kugi     kashiwa      mikado   sei-ryori  todo-matsu       tycon
          9           9           9           9           9           9           9           9
       <NA>
          0
Hide
(3)関数plot()
# plot("X軸","Y軸")
x <- c(1:10)
y <- c(10:1)
plot(x,y)
In strsplit(code, "\n", fixed = TRUE) :
input string 1 is invalid in this localeHide
# hane-mijikaの個体数
N <- data$N[data$species == "hane-mijika" ]
plot(date, N)
プロットの形
pch = 数字, pch = “文字”
Hide
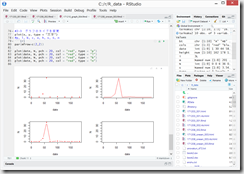
par(mfrow=c(2,2))
plot(date, N, pch=3)
plot(date, N, pch=20)Hide
plot(date, N, pch="$")
plot(date, N, pch="A")
色の変更
col = “color”
col = “数字”
##cf. colors
Hide
par(mfrow=c(2,2))
plot(date, N, pch = 20, col = "red")
plot(date, N, pch = 20, col = "darkblue")Hide
plot(date, N, pch = 20, col = 3)
2-3 グラフのタイプを変更
plot(x, y, type = “文字”)
#p, l, b, c, o, h, s, S, n
Hide
par(mfrow=c(2,2))
plot(date, N, pch = 20, col = "red", type = "p")
plot(date, N, pch = 20, col = "red", type = "l")Hide
plot(date, N, pch = 20, col = "red", type = "b")
plot(date, N, pch = 20, col = "red", type = "n")
2-4 グラフのタイトル、x軸やy軸に名前を入れられる
Hide
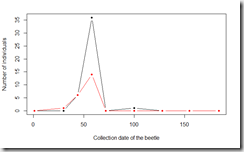
plot(date, N,
pch = 20,
col = "black",
type = "b",
xlab = "Collection date of the beetle",
ylab = "Number of individuals")
2-5 一枚のシートに複数のグラフを重ねる
In strsplit(code, "\n", fixed = TRUE) :
  input string 1 is invalid in this locale
Hide
# "hane-mijika"の日付
date <- data$period[data$species == "hane-mijika" ]
# "hane-mijika"の個体数
N <- data$N[data$species == "hane-mijika"]
# tyonのデータを読み込む
#"tycon"の日付
data_t <- data$period[data$species == "tycon"]
#"tycon"の個体数
N_t <- data$N[data$species == "tycon"]
# "hane-mijika"の折れ線グラフ
plot(date, N,
     pch = 20,
     col = "black",
     type = "b",
     xlab = "Collection date of the beetle",
     ylab = "Number of individuals")
# グラフを重ねるときはplotではなく、pointsを使う
points(data_t, N_t,
pch = 20,
col = "red",
type = "b")
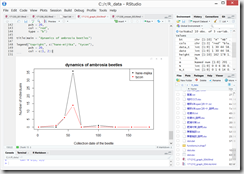
2-6 グラフにタイトル・凡例をつける
title(main = “dynamics of ambrosia beetles”)
Hide
date <- data$period[data$species == "hane-mijika" ]
N <- data$N[data$species == "hane-mijika"]
data_t <- data$period[data$species == "tycon"]
N_t <- data$N[data$species == "tycon"]
plot(date, N,
     pch = 20,
     col = "black",
     type = "b",
     xlab = "Collection date of the beetle",
     ylab = "Number of individuals")
points(data_t, N_t,
       pch = 20,
       col = "red",
       type = "b")
Hide
title(main = "dynamics of ambrosia beetles")
legend("topright", c("hane-mijika", "tycon"),
       pch = 20,
       col = c(1, 2))
少しだけ、Rでグラフが描けるようになった気がする。
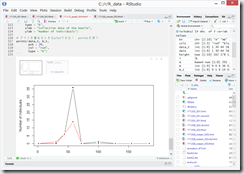
本当は、x軸のラベルを変更したい。
2-7 グラフのx軸の目盛を文字列にする
plot(…, xaxt=“n”) # 元の目盛を非表示にする
axis()関数を用いて、目盛を文字列の配列に置き換える。 sideとか、atとか必須。 axis(side=1, at=0:7, labels=c(“Day0”, “Day1”, “Day2”, “Day3”, “Day4”, “Day5”, “Day6”, “Day7”))
Hide
date <- data$period[data$species == "hane-mijika" ]
N <- data$N[data$species == "hane-mijika"]
data_t <- data$period[data$species == "tycon"]
N_t <- data$N[data$species == "tycon"]
plot(date, N,
     pch = 20,
     col = "black",
     type = "b",
     xlab = "Collection date of the beetle",
     ylab = "Number of individuals",
     xaxt = "n")
points(data_t, N_t,
       pch = 20,
       col = "red",
       type = "b")
Hide
title(main = "dynamics of ambrosia beetles")
legend("topright", c("hane-mijika", "tycon"),
       pch = 20,
       col = c(1, 2))
Hide
axis(side=1, at=c(0, 50, 100, 150), labels=c("Day0", "Day50", "Day100", "Day150"))
次は、ggplotの使い方の勉強かな。。。ggplotいらないかな。。。
(参考)
2015.01.30 統計学・R
【R】条件に合う行数をカウントする方法
https://winlabo.com/post-814
table 関数を使ったクロス集計
http://nshi.jp/contents/r/crosstab/
2014-07-05
軸の目盛りを文字列にする
http://jundoll.hatenablog.com/entry/2014/07/05/234337
R 使い方 軸と目盛りの調整まとめ グラフの描き方
2016年8月23日 bioinfo-dojo
http://bioinfo-dojo.net/2016/08/23/r_graph_axisinfo/
R 使い方 軸・ラベルの調整(向き・サイズ・色など) グラフの描き方
2016年11月24日 bioinfo-dojo
http://bioinfo-dojo.net/2016/11/24/various_axis_r/
R でプログラミング:データの一括処理とグラフ描き
13. 見栄えのよいグラフ(その2):複数の図と軸の説明(+ 日本語の表示)
updated on 2009-03-31
http://takenaka-akio.org/doc/r_auto/chapter_13.html



ディスカッション
コメント一覧
まだ、コメントがありません