「Rではじめるデータサイエンス」を写経(2)dplyr
Rで統計のグラフを描けるようになりたくて、以下の本を読んでいる。
上記本の、英語の本文のサイト http://r4ds.had.co.nz/
練習問題の解答例 https://jrnold.github.io/e4qf/
前回は、第1章のggplot2の基本について勉強してみた。
http://twosquirrel.mints.ne.jp/?p=21626
今回は、グラフを描く前処理で利用する、dplyrについて学んでみる。
(環境)
Windows 8.1 Pro
R Studio 1.1.383
tidyverse パッケージ
<参考ページ>
気まぐれで、先に、以下のページを写経してみる。
https://heavywatal.github.io/rstats/tidyr.html
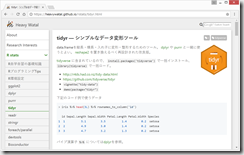
(1) data.frameをtidyrを使っていろいろしてみる。
目標は、時系列データのグラフをggplotで簡単に描くこと。
「Rではじめるデータサイエンス」を写経してみる
tidyverseパッケージのインストール
tidyr
https://heavywatal.github.io/rstats/tidyr.html
Hide
library(tidyverse)
iris %>%
  head(3L) %>%
  rownames_to_column('id')
tidyr::gather() で縦長にする
複数列にまたがっていた値を、カテゴリ変数と値の2列に変換することで、横長(wide-format)のdata.frameを縦長(long-format)に変形する。
Hide
library(tidyverse)
data_plot_individuals <- iris %>%
  head(3L) %>%
  rownames_to_column('id') %>%
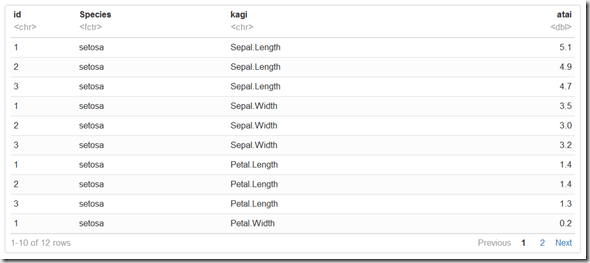
  gather(kagi, atai, -id, -Species)
data_plot_individuals
ggplot2
ggplot2はtidyverseパッケージに入っている。
https://github.com/tidyverse/ggplot2
Hide
library(tidyverse)
data_plot_individuals <- iris %>%
  rownames_to_column('id') %>%
  gather(kagi, atai, -id, -Species)
a <- ggplot(data_plot_individuals, aes(x = kagi, y = atai, group = Species, colour = Species)) +
  geom_point(aes(colour=Species))
a
Hide
自前データでやってみる
library(tidyverse)
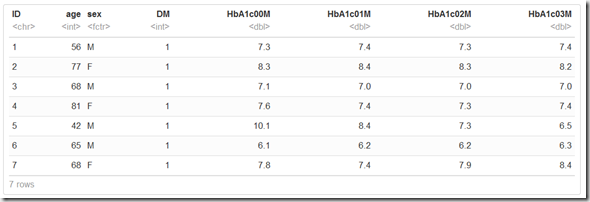
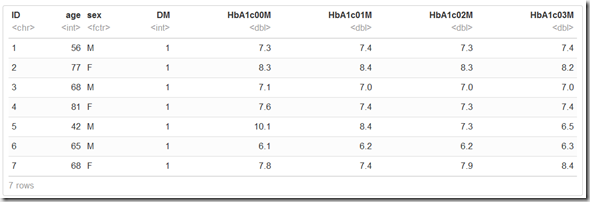
x <- read.csv("book2.csv")
x
Hide
library(tidyverse)
x <- read.csv("book2.csv")
data_plot_individuals <- x %>%
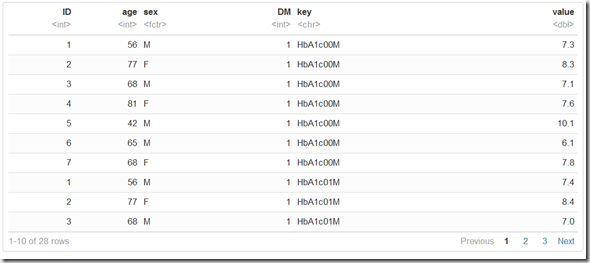
  gather(key, value, -ID, -age, -sex, -DM)
data_plot_individuals
各患者でHbA1cの時系列の折れ線グラフ(IDでグループ分け)
Hide
library(tidyverse)
x <- read.csv("book2.csv")
data_plot_individuals <- x %>%
  gather(key, value, -ID, -age, -sex, -DM)
a <- ggplot(data_plot_individuals, aes(x = key, y = value, group = ID, colour = ID)) +
  geom_line()
a
IDが数値扱いになり、色分けが変な風になってしまう。
そのため、IDを文字列として認識させる。
Hide
library(tidyverse)
x <- read.csv("book2.csv")
x$ID <- as.character(x$ID)
x
data_plot_individuals <- x %>%
gather(key, value, -ID, -age, -sex, -DM)
a <- ggplot(data_plot_individuals, aes(x = key, y = value, group = ID, colour = ID)) +
geom_line()
a男女で平均とSDを求める
Hide
library(tidyverse)
x <- read.csv("book2.csv")
x$ID <- as.character(x$ID)
x
data_plot_individuals <- x %>%
gather(key, value, -ID, -age, -sex, -DM)
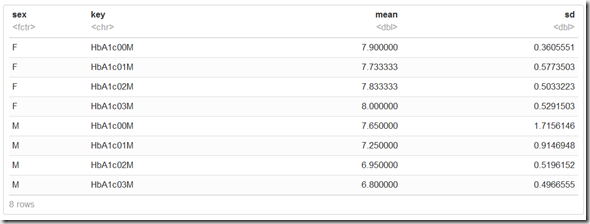
group_time_mean_sd <- data_plot_individuals %>%
group_by(sex, key) %>%
summarize(mean = mean(value), sd=sd(value))
group_time_mean_sd 男女で平均とSDを求めて折れ線グラフ
Hide
library(tidyverse)
x <- read.csv("book2.csv")
x$ID <- as.character(x$ID)
x
Hide
data_plot_individuals <- x %>%
  gather(key, value, -ID, -age, -sex, -DM)
group_time_mean_sd <- data_plot_individuals %>%
  group_by(sex, key) %>%
  summarize(mean = mean(value), sd=sd(value))
b <- ggplot(group_time_mean_sd, aes(x=key, y=mean, group=sex, colour=sex)) +
  geom_line()
b
エラーバー
Hide
library(tidyverse)
x <- read.csv("book2.csv")
x$ID <- as.character(x$ID)
x
data_plot_individuals <- x %>%
gather(key, value, -ID, -age, -sex, -DM)
group_time_mean_sd <- data_plot_individuals %>%
group_by(sex, key) %>%
summarize(mean = mean(value), sd=sd(value))
b <- ggplot(group_time_mean_sd, aes(x=key, y=mean, group=sex, colour=sex)) +
geom_line()
errors <- aes(ymax = mean + sd, ymin = mean - sd)
b <- b + geom_errorbar(errors, width = 0.2) + geom_point(aes(colour=sex, shape=sex), size=4)
b縦軸を指定
Hide
library(tidyverse)
x <- read.csv("book2.csv")
x$ID <- as.character(x$ID)
xHide
data_plot_individuals <- x %>%
  gather(key, value, -ID, -age, -sex, -DM)
group_time_mean_sd <- data_plot_individuals %>%
  group_by(sex, key) %>%
  summarize(mean = mean(value), sd=sd(value))
b <- ggplot(group_time_mean_sd, aes(x=key, y=mean, group=sex, colour=sex)) +
  geom_line()
errors <- aes(ymax = mean + sd, ymin = mean - sd)
b <- b + geom_errorbar(errors, width = 0.2) + geom_point(aes(colour=sex, shape=sex), size=4)
b <- b +
scale_x_discrete(labels=c(0,1,2,3))
b <- b +
coord_cartesian(ylim = c(0,10)) +
scale_y_continuous(breaks=seq(0,10,by=2), labels=c(0,2,4,6,8,10))
b微調整
Hide
b <- b + theme(axis.title.x = element_text(size=20, family="Arial"),
               axis.title.y = element_text(size=20, family="Arial"),
               axis.text.x = element_text(size=20, colour=1, family="Arial"),
               axis.text.y = element_text(size=20, colour=1, family="Arial"))
b <- b + labs(x="Time(month)", y="HbA1c(%)")
b
論文用
Hide
c <- b + theme_classic()
c
論文用体裁その2
Hide
library(tidyverse)
d <- ggplot(group_time_mean_sd,
            aes(x=key, y=mean, group=sex)) +
  geom_line(aes(linetype=sex))
d <- d + geom_point(aes(shape=sex), size=4)
d <- d + theme_classic()
d <- d + theme(axis.title.x = element_text(size=20, family="Arial"),
               axis.title.y = element_text(size=20, family="Arial"),
               axis.text.x = element_text(size=20, family="Arial"),
               axis.text.y = element_text(size=20, family="Arial"))
d <- d + labs(x="Time(month)", y="HbA1c(%)")
errors <- aes(ymax = mean + sd, ymin = mean - sd)
d <- d + geom_errorbar(errors, width=0.2)
d <- d +
  scale_x_discrete(labels=c(0,1,2,3))
d <- d +
  coord_cartesian(ylim = c(0,10)) +
  scale_y_continuous(breaks=seq(0,10,by=2), labels=c(0,2,4,6,8,10))
d
途中
(参考)
【R】数値を文字列に置換する
https://qiita.com/weda_654/items/24826360580959240b11
@weda_654
2017年03月15日に更新
https://qiita.com/ytakeda/items/b996d93b33803409efb3
@ytakeda
2016年03月04日に投稿
R 複数列の型変換をまとめて行う方法
http://mukkujohn.hatenablog.com/entry/2016/10/08/155023
2016-10-08
ggplot2を使って、軸を制御する-2
Rグラフィックスクックブック





ディスカッション
コメント一覧
まだ、コメントがありません